August 2008
Field Crops 28.47-59
Fall Management Decisions and Practices for Corn
Joe Lauer, Corn Agronomist
PDF Version
Growing Season Update
The 2008 production year has been one of the coolest on record. Growing degree unit
accumulation is tracking about 300 GDUs behind schedule. Temperature drives the
vegetative (V) developmental stages of the corn life cycle, but has less influence
during the reproductive (R) developmental stages (Table 1). The number of days from
silking (R1) to maturity (R6) ranges from 55 to 60 days. A farmer benchmark to gauge
the season is "To be dented by Labor Day." About 26-28 days remain for the crop
to mature. Optimum silage yield and quality occurs around 50% Kernel Milk (R5.5)
(Figure 1).
|
Table 1. Relationship between corn kernel growth stage and development.
|
|
|
|
Growing Degree Units
(GDUs) to Maturity
|
Percent of
Maximum Yield
|
Moisture
Content (%)
|
|
Stage
|
Calendar Days
to Maturity
|
Southern
Wisconsin
|
Northern
Wisconsin
|
Grain
|
Whole
Plant
|
Grain
|
Whole
Plant
|
|
R1- Silk
|
55-60
|
1100-1200
|
950-1050
|
0
|
50-55
|
---
|
80-85
|
|
R2 - Blister
|
45-50
|
875-975
|
800-900
|
0-10
|
55-60
|
85-95
|
80-85
|
|
R3 - Milk
|
37-42
|
750-850
|
700-800
|
15-25
|
60-65
|
75-85
|
77-82
|
|
R4 - Dough
|
31-36
|
600-700
|
550-650
|
30-50
|
65-75
|
60-80
|
75-80
|
|
R5 - Dent
|
26-28
|
425-525
|
400-500
|
60-75
|
75-85
|
50-55
|
70-75
|
|
R5.5 - 50% Kernel milk
|
10-15
|
200-300
|
175-275
|
90-95
|
100
|
35-40
|
65-70
|
|
R6 - Maturity
|
0
|
0
|
0
|
100
|
95-100
|
25-35
|
55-65
|
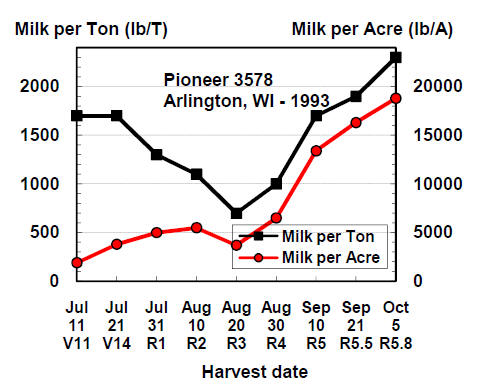
Figure 1. Corn silage yield and quality changes during development.
In-season guidelines for predicting corn silage harvest date
- Note hybrid maturity and planting date of fields intended
for silage.
- Note tasseling (silking) date. Kernels will be at 50% kernel
milk (R5.5) about 42 to 47 days after silking.
- After milkline moves, use kernel milk triggers to time
corn silage harvest (Figure 2). Use a drydown rate of 0.5% per day to predict date
when field will be ready for the storage structure (Table 2). See
http://www.uwex.edu/ces/ag/silagedrydown/
- Do final check prior to chopping.
|
Table 2. Kernel milk stage "Triggers" for timing silage harvest.
|
|
Silo Structure
|
Ideal Moisture
Content
|
Kernel Milk
Stage "Trigger"
|
|
|
%
|
%
|
|
Horizontal bunker
|
70 to 65
|
80
|
|
Bag
|
70 to 60
|
80
|
|
Upright concrete stave
|
65 to 60
|
60
|
|
Upright oxygen limiting
|
50 to 60
|
40
|
|
"Trigger": kernel milk stage to begin checking moisture
Silage moisture decreases at an average rate of 0.5% per day during September
|
Selecting Corn Hybrids
PPast hybrid trials indicate that the average yield difference between the highest
and lowest yielding corn hybrid in a trial is 70 bu/A. Your challenge is to predict
performance the next growing season. Depending upon how you select hybrids, yield
gains up to 12 bu/A can be achieved over an "average" hybrid.
When choosing hybrids for the next growing season:
- Select hybrids using multi-location average data. Consider single location results
with extreme caution.
- Evaluate consistency over years and other trials. Be wary of hybrids that are not
top performers in all trials.
- Buy the traits you need (Table 3, aslo see
spreadheet). Traits protect yield, they do not add to yield. Can you grow corn
the "old-fashioned" way?
- Rotation
- Weed control
- European Corn Borer
- Every hybrid must "stand on its own" for performance (Table 4).
|
Table 3. Economic advantage ($/A) of Hybrid A or (Hybrid B).
Seed price difference = $50 bag: A = $150, (B) = $200
|
|
Yield advantage
|
Corn Price ($/bu)
|
|
Hybrids
|
(bu/A)
|
$1.00
|
$2.00
|
$3.00
|
$4.00
|
$5.00
|
$6.00
|
$7.00
|
|
|
(14)
|
$8
|
($6)
|
($20)
|
($34)
|
($48)
|
($62)
|
($76)
|
|
|
(12)
|
$10
|
($2)
|
($14)
|
($26)
|
($38)
|
($50)
|
($62)
|
|
|
(10)
|
$12
|
$2
|
($8)
|
($18)
|
($28)
|
($38)
|
($48)
|
|
A < (B)
|
(8)
|
$14
|
$6
|
($2)
|
($10)
|
($18)
|
($26)
|
($34)
|
|
|
(6)
|
$16
|
$10
|
$4
|
($2)
|
($8)
|
($14)
|
($20)
|
|
|
(4)
|
$18
|
$14
|
$10
|
$6
|
$2
|
($2)
|
($6)
|
|
|
(2)
|
$20
|
$18
|
$16
|
$14
|
$12
|
$10
|
$$8
|
|
A = (B)
|
0
|
$22
|
$22
|
$22
|
$22
|
$22
|
$22
|
$22
|
|
|
2
|
$24
|
$26
|
$28
|
$30
|
$32
|
$34
|
$36
|
|
|
4
|
$26
|
$30
|
$34
|
$38
|
$42
|
$46
|
$50
|
|
|
6
|
$28
|
$34
|
$40
|
$46
|
$52
|
$58
|
$64
|
|
A > (B)
|
8
|
$30
|
$38
|
$46
|
$54
|
$62
|
$70
|
$78
|
|
|
10
|
$32
|
$42
|
$52
|
$62
|
$72
|
$82
|
$92
|
|
|
12
|
$34
|
$46
|
$58
|
$70
|
$82
|
$94
|
$106
|
|
|
14
|
$36
|
$50
|
$64
|
$78
|
$92
|
$106
|
$120
|
Remember that you don't know what weather conditions (rainfall, temperature) will
be like next year. Therefore, the most reliable way to predict hybrid performance
next year on your farm is to consider past performance over a wide range of locations
and climatic conditions.
|
Table 4. Relative performance among corn hybrid "Families" compared to the normal
line grown in the same trial
|
|
Family
|
Specialty Trait
|
N
|
Grain
yield
|
Grain
moisture
|
Lodging
|
|
|
|
|
Bu/A
|
%
|
%
|
|
A12
|
DDBT418
|
6
|
1
|
1
|
2
|
|
A12
|
MMon810
|
6
|
20
|
1
|
-3
|
|
A12
|
MMonGA21
|
25
|
2
|
0
|
-1
|
|
B99
|
MMon810
|
3
|
15
|
3
|
-2
|
|
B99
|
MMon810+T25
|
3
|
-2
|
1
|
-1
|
|
C284
|
MMon810
|
24
|
17
|
1
|
-1
|
|
C284
|
MMon810+IT
|
6
|
-3
|
0
|
-1
|
Recommended Practices v. Trends v. "Snake Oils"
TThe 2008 corn production and marketing season is unique. On one hand, it is the
most expensive corn crop ever planted, and on the other, it has the potential to
be the most profitable due to strong market price. If input costs continue to increase,
profit margin will be back to previous years, except with more risk.
So for this year, we have strong prices relative to input costs, thus any production
increase can be more easily paid for. We have to be careful about practices that
can be recommended versus practices that intuitively may trend to greater yields,
but are not statistically significant and thus cannot be recommended. These trends
produce responses too small to be statistically significant.
In agronomic research it is very difficult to detect treatment differences less
than 5%. So in a 200 bu/A yield environment, that means at least 10 bu/A is required
before statistical differences can be detected. What about trends less than 10 bu/A?
At today's prices a difference of even 5 bu/A can pay for many inputs.
Every year in Wisconsin, products are touted to producers as being the cure for
crop production and economic woes. The adage "If it sounds too good to be true,
then it probably is." How do you know whether a particular product is a viable
fertilizer and supplies crop nutrients, or has some proven effect on soil that will
improve productivity? The standard advice is to demand unbiased research results
that document all claims, and to discount testimonials. If well-documented research
isn't available, then be suspicious of claims. An electronic compendium is available
that provides information on non-traditional materials marketed for use in crop
production in the north central region of the USA. It is a collection of research
abstracts and reports released by scientists in State Agricultural Experiment. See
the website: http://extension.agron.iastate.edu/compendium/index.aspx