April, 1997
Field Crops 28.31-12
The University of Wisconsin Corn Hybrid Trials --
Selecting the Top Performers
Joe Lauer and Keith Hudelson
University of Wisconsin
Printer friendly version
Abstract
Farmers often use a combination of on-farm, seed company, and university trials to
select hybrids for planting the following year. Our objective was to evaluate selection
methods for identifying and predicting future hybrid performance. A total of 24
hybrid selection schemes were evaluated using performance data from University of
Wisconsin Corn Hybrid Trials conducted between 1977 and 1995. The yield rank of
a hybrid in the selection year was compared to the trial average the next year.
Selecting a hybrid using the results of only one trial increased grain yield 4 to
6 percent and grower return increased $12 to $17 per acre over the trial average.
The hybrid selection decision was improved by using a multi-location average. Hybrids
ranking in the top 10% of hybrids in a production zone and at three or more locations
had grain yields 11 to 15 bushels (7 to 9% increase) and $24 to $33 more than the
trial average. Since most farmers do not have the resources to conduct on-farm trials
of all hybrids at several locations, using unbiased results from other trials can
increase the chances for picking a top hybrid.
One of the most important decisions a corn farmer makes is the selection of high
performing, adapted hybrids. Selecting the correct hybrid can often mean the difference
between profit and loss. Plant breeders and agronomists test thousands of commercial
and new experimental hybrids for several years at many locations over a range of
plant populations and other management practices. These corn hybrid performance
trials determine which hybrids have yielding ability superior to current hybrids
and estimate disease resistance and other important characteristics.
Prior to 1970, agronomists at the University of Wisconsin concentrated on evaluation
of new hybrids developed by university corn breeding programs. Commercial hybrids
sold to Wisconsin farmers were evaluated primarily for maturity. Beginning in 1972,
a performance evaluation program of commercial hybrids was begun by E.A. Brickbauer.
Commercial entries were solicited and entered by companies at eight locations. The
number of testing sites gradually expanded to 13 locations. In 1985, P.R. Carter
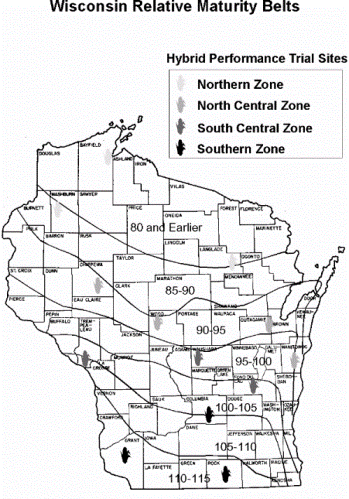
divided the locations into four production zones of three to four testing sites
each (see map). These production zones had an "early" and "late"
trial with a cut-off of 105-, 100-, and 90-day relative maturity for the Southern,
South Central, and North Central production zones. When a commercial hybrid was
entered into the performance evaluation program, it was tested at all locations
in the production zone. In 1995, a corn hybrid silage evaluation program was initiated
by J.G. Lauer. Silage yield and quality was evaluated at two sites in each production
zone. Corn grain and silage performance data between 1977 and 1995 was compiled
into a computer software program called SELECT!
How good are these trials for predicting performance of the top hybrid next year?
Should a farmer conduct an on-farm trial or rely on results from seed companies
and Universities to predict hybrid performance on-farm? Our objective was to evaluate
selection methods for identifying and predicting future hybrid performance.
Materials and Methods
Performance data from University of Wisconsin corn hybrid trials conducted between
1975 and 1995 were analyzed. Over 30,000 hybrid-location-year tests were derived
from the SELECT! database. Selection schemes were developed by selecting ranked
hybrids and pooling by various combinations of years, locations and zones (Table
1). Performance was measured by determining the rank of the hybrid in the trial,
the grain yield difference, relative yield and grower return difference.
Grain yield difference = grain yield of the selected hybrids for the pooling method
minus the trial average.
Relative yield = yield of selected hybrids for the pooling method ) trial average
Grower return difference = grower return of the selected hybrids for the pooling
method minus the trial average, where corn price = $2.65 per bushel, handling =
$0.017 per bushel, hauling = $0.04 per bushel, and drying = $0.015 per point per
bushel above 15.5 % moisture.
Hybrids were selected using four methods: 1) Top hybrid, 2) Top three hybrids, 3)
Top hybrid in three maturity groups around the maturity cut-off for the zone, and
4) Top 10% of hybrids. Selecting the top three hybrids and the top hybrid by maturity
group was an attempt to select hybrids which were more "stable" for yield.
Results and Discussion
Selection schemes differed in the number of cases which fulfilled the pooling criteria
(Table 1). For example, there were 1,570 cases where hybrids ranked in the top 10%
at a location in one year were tested the following year (scheme 4). There were
41 cases where the top three hybrids in a zone and at three or more locations in
one year were tested the following year (scheme 14). No cases were found where a
hybrid was the top performer in a zone and at three locations in one year (scheme
13).
Predicting performance based on one location
Typically, about 80 to 150 hybrids are tested in a trial at a location. When hybrids
ranked in the top 10% of a trial (scheme 4) were grown the following year, grain
yield was 4% above average, and profit increased $14 per acre over an average hybrid
(Table 1). Hybrids ranked in the bottom 10% of a trial (scheme 18) and grown the
following year would be 9 bushels lower (7% decrease) and lose $21 per acre compared
to an average hybrid. If the top hybrid at a location (scheme 1) is grown the next
year, grain yield
Can performance predictions be improved?
Numerous schemes can be devised. The University of Wisconsin model recommends that
hybrids be selected on the basis of top performance across a production zone and
at individual locations in the zone (schemes 13-16) and where possible use two or
more years of data (schemes 21 and 22). Selecting hybrids using these schemes increases
grain yield 11 to 15 bushels per acre (7 to 9% increase) and generated $24 to $32
more profit than the trial average.
How long should you stay with a top-performing hybrid?
A hybrid which was a top-performer in a zone and at three or more locations in a
year (scheme 16) continued to return $14 to $18 more than the trial average 3 to
4 years after its top performing year (Table 4). Hybrids selected on the basis of
location or zone performance (schemes 4 and 8) only returned $6 to $10 more than
the trial average.
What are the chances of a top hybrid repeating its performance next year?
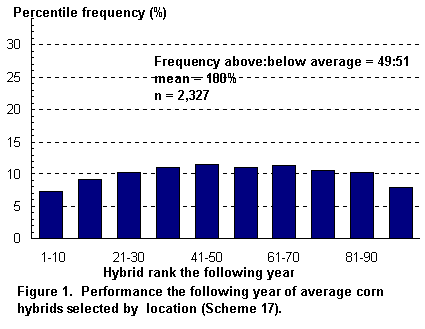
When a coin is flipped often enough, a 50:50 chance exists of getting either "heads"
or "tails." Testing an "average" hybrid results in a 49:51 percent
chance that it will be either above or below the trial average when grown the next
year (Figure 1). An "average" hybrid ranks in the top 10 percent of the
hybrids of a trial the following year about 7 percent of the time. However, an equal
chance exists for an "average" hybrid to rank in the bottom 10 percent
of the hybrids in a trial the following year.
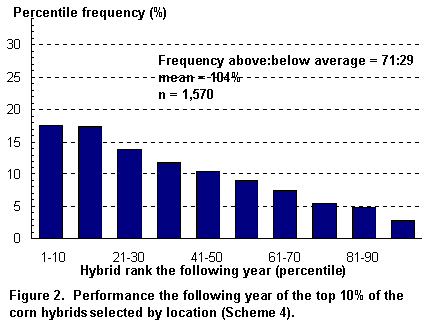
Hybrids ranked in the top 10% of a trial and grown the following year in the same
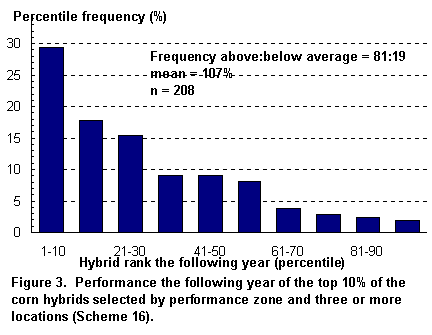
location and trial beat the trial average 71 percent of the time (Figure 2). But,
a hybrid which ranked in the top 10% of the hybrids in a production zone and at
three or more locations in that zone beat the trial average 81 percent of the time
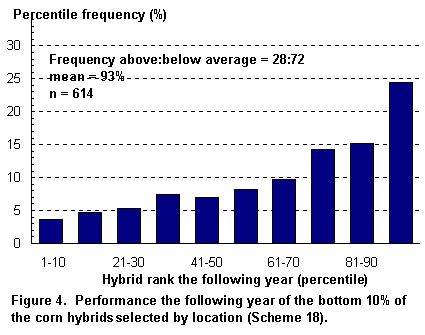
(Figure 3). For reference, the performance probability of hybrids ranked in the
bottom 10% of a trial are shown in Figure 4.
Summary
Should farmers go through the trouble and expense of testing 80 to 150 hybrids in
an on-farm test? These data suggest that a well run test across numerous locations
in a production zone can predict hybrid performance at a location as well as or
better than an on-farm test. Clearly, using performance information across a production
zone and numerous locations and management conditions will increase your chances
of picking a profitable hybrid. Certainly, an on-farm test in conjunction with seed
company trials, and University trials would probably give the best information if
all hybrids of interest were in the trials. Since most farmers do not have the resources
to conduct on-farm trials at several locations, using unbiased results from other
trials to supplement on-farm yield results can increase the chance of picking a
hybrid that will do well next year.
|
Table 1. The combination of years, locations, zones, and selected hybrids used to
create the 24 selection schemes.
|
|
|
Pooling method
|
|
Grain yield
|
Relative
|
Grower return
|
|
Scheme
|
Years
|
Trials *
|
Hybrids selected
|
Cases
|
difference
|
yield
|
difference
|
|
|
|
|
|
|
bu/A
|
percent
|
$/A
|
|
1
|
1
|
L
|
Top one
|
232
|
7
|
106
|
16
|
|
2
|
1
|
L
|
Top three
|
643
|
7
|
105
|
17
|
|
3
|
1
|
L
|
Top one MG **
|
478
|
5
|
104
|
12
|
|
4
|
1
|
L
|
Top 10%
|
1,570
|
6
|
104
|
14
|
|
5
|
1
|
Z
|
Top one
|
148
|
8
|
105
|
17
|
|
6
|
1
|
Z
|
Top three
|
473
|
8
|
106
|
19
|
|
7
|
1
|
Z
|
Top one MG
|
324
|
6
|
104
|
14
|
|
8
|
1
|
Z
|
Top 10%
|
953
|
7
|
105
|
16
|
|
9
|
1
|
Z and 1L
|
Top one
|
63
|
10
|
108
|
23
|
|
10
|
1
|
Z and 1L
|
Top three
|
432
|
8
|
106
|
18
|
|
11
|
1
|
Z and 1L
|
Top one MG
|
176
|
6
|
105
|
16
|
|
12
|
1
|
Z and 1L
|
Top 10%
|
549
|
8
|
105
|
18
|
|
13
|
1
|
Z and 3L
|
Top one
|
0
|
--
|
--
|
--
|
|
14
|
1
|
Z and 3L
|
Top three
|
41
|
15
|
109
|
33
|
|
15
|
1
|
Z and 3L
|
Top one MG
|
33
|
11
|
109
|
25
|
|
16
|
1
|
Z and 3L
|
Top 10%
|
208
|
11
|
107
|
24
|
|
17
|
1
|
L
|
Average
|
2,327
|
0
|
100
|
-1
|
|
18
|
1
|
L
|
Bottom 10%
|
614
|
-9
|
93
|
-21
|
|
19
|
2
|
L
|
Top 10%
|
460
|
11
|
107
|
25
|
|
20
|
2
|
Z
|
Top 10%
|
302
|
13
|
109
|
31
|
|
21
|
2
|
Z and 1L
|
Top 10%
|
126
|
14
|
109
|
32
|
|
22
|
2
|
Z and 3L
|
Top 10%
|
138
|
13
|
108
|
31
|
|
23
|
2
|
L
|
Average
|
561
|
-1
|
100
|
-2
|
|
24
|
2
|
L
|
Bottom 10%
|
126
|
-18
|
86
|
-42
|
|
* L = Location and Z = Production Zone I**MG = Top hybrid for three Maturity Groups
for the zone
|
|
Table 2. Grower return over time of corn hybrids selected using various schemes.
|
|
Selection
|
Previous years
|
Selected year
|
Future years
|
|
scheme
|
-2
|
-1
|
0
|
1
|
2
|
3
|
4
|
|
|
dollars per acre difference *
|
|
4
|
23
|
20
|
52
|
14
|
10
|
10
|
6
|
|
8
|
23
|
23
|
44
|
16
|
14
|
10
|
7
|
|
12
|
25
|
26
|
58
|
18
|
14
|
11
|
9
|
|
16
|
38
|
37
|
51
|
24
|
23
|
14
|
18
|
|
17
|
11
|
9
|
0
|
-1
|
-2
|
-3
|
-4
|
|
18
|
-5
|
-9
|
-60
|
-21
|
-20
|
-23
|
-23
|
|
* difference = grower return of selected hybrids - trial average
|
