March 2007
Field Crops 28.62-47
How Good is the USDA Spring Corn Acreage Projection?
Joe Lauer, Corn Agronomist
PDF Version
This winter as I visited with farmers about their crop intentions for the 2007 growing
season, I found that many intended to keep corn-soybean acreage the same. If there
was a change it was usually the intention to grow more corn acres (2/3 or 3/4 of
acres). I only visited with a couple farmers who intended to grow 100% corn on their
farm in 2007.
Results of the spring USDA survey of farmer planting intentions will be published
March 30. This year the survey results are much anticipated by farmers, prognosticators
and traders. An already volatile corn market could become even more volatile. A
lot can happen between the publishing of this survey and what actually gets planted.
Weather problems, replanting, changing markets, seed and input availability all
influence what will eventually get planted. I was curious as to how well the USDA
survey predicted actual planted acreage later in the growing season.
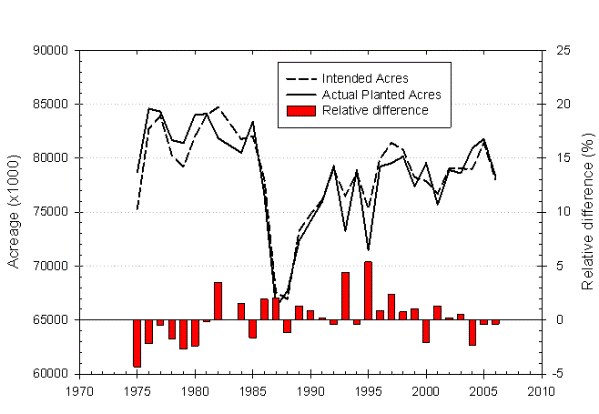
Figure 1 shows results for the U.S. Intended and actual acreage has fluctuated widely
with significant drops during 1987, 1988, 1993 and 1995. But, the relative difference
between intended and actual acreage is + 5%. The worst years were 1975 when
acreage was under predicted by -4.4% and 1995 when acreage was over predicted by
5.4%. During the early years of the survey acreage was typically underestimated.
Over the last 10 years the relative difference between intended and planted acreage
was -2.4 to 2.3%.
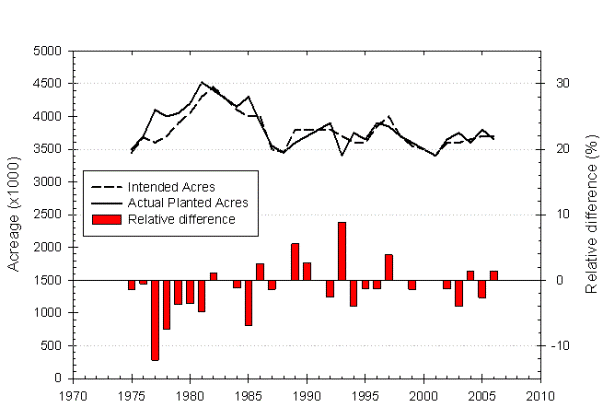
Figure 2 shows results for Wisconsin. Acreage was typically underestimated during
the early years of the Wisconsin survey, but in the last 10 years has been fairly
reflective of what eventually gets planted. In 1977 acreage was underestimated by
12.2%, and in 1993 acreage was overestimated by 8.8%.
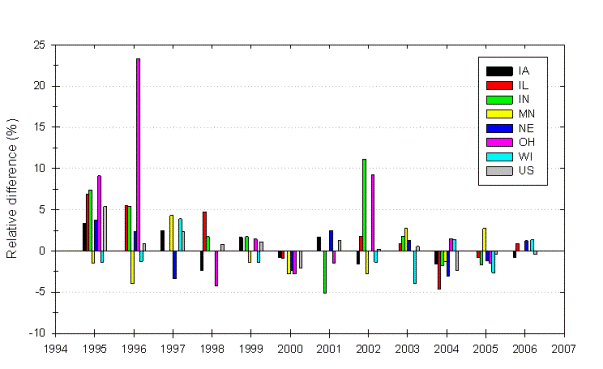
Some states have more trouble predicting planted acres from intended plantings (Figure
3). Ohio and Indiana over-predicted acres during 2002 by 9.2 and 7.4%. Ohio over-predicted
acres during 1995 and 1996 by 9.1 and 23.3%. In general, most states over the last
12 years have been within + 5% of the intended acres that actually get planted.
Many predictions are that the U.S. corn acreage could go above 85 million acres.
We have been close to that figure before. Regardless of the USDA track record for
predicting planted acres from the intentions survey, the 2007 growing season is
shaping up to be a "wild ride" for marketing. The first indicator of what
might be in store is the March 30 survey publication. As we head into the months
of April and May many changes will likely take place. We won't know for sure what
acres we will end up with until we see the June report.

Figure 1. USDA intended corn acreage and actual acreage planted from 1975 to 2006
in the U.S. Vertical bars represent the relative difference (%) between intended
and actual acreage.

Figure 2. USDA intended corn acreage and actual acreage planted from 1975 to 2006
in Wisconsin. Vertical bars represent the relative difference (%) between intended
and actual acreage.

Figure 3. The relative difference (%) between USDA intended corn acreage and actual
acreage planted from 1995 to 2006 in IA, IL, IN, MN, NE, OH, WI and the U.S.