June 20, 2009
Field Crops 28.1 - 67
What is Happening in the Corn Crop Canopy?
Joe Lauer, Corn Agronomist
This year has been cooler than normal. In fact it is the fourth coolest year in
the last 30 years so far. But things can change rapidly and the corn crop seems
to keep on developing, although this year it seems like plants are taking longer
than usual to develop. At this date most fields are between V5 and V7 and poised
to begin a period of rapid stem elongation and canopy development. Once the
plant has achieved the V5-V6 stage of development, all of the plant parts that
will eventually appear have been expressed on the growing point. It is just a
matter of time until we see them.
The yield component being determined at this time is the number of kernel rows
around the ear. This component will be fixed by V10. Usually somewhere between
12 and 14 rows typically develop on an ear, but up to 20 or 22 can be expressed
on a "girthy" ear.
Most fields have good green color on the leaves and fields in general have a
better appearance than a few weeks ago. Many significant changes are occurring
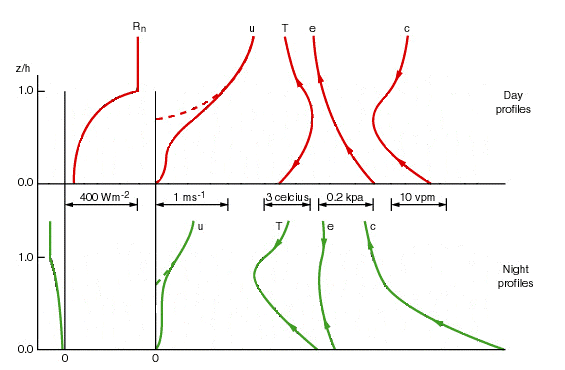
in the crop canopy. Figure 1 describes some of these changes (Monteith and
Unsworth, 2008). This graph shows the changes within the crop canopy for net radiation (Rn), windspeed
(u), air temperature (T), vapor pressure (e) and CO2 concentration (c) in a
field of corn growing to a height h plotted as a function z/h, where z is the
height above the surface and h is the height of the canopy. The top part of the
figure pertains to typical daytime profiles, the bottom part to night profiles.
The value between the measurement profiles is the range of the measurement
within the canopy.

Figure 1. Idealized profiles of net radiation (Rn), windspeed
(u), air temperature (T), vapor pressure (e) and CO2 concentration
(c) in a field of corn growing to a height h plotted as a function z/h, where z
is the height above the surface and h is the height of the canopy.
For example, net radiation (Rn) is greatest above the crop canopy and attenuates
as you move down towards the soil surface. At night there is a net loss of
radiation, especially at the top of the crop canopy. Wind speed (u) is greatest
above the canopy and decreases as you move down into the canopy. Carbon dioxide
concentration, which is an indirect measure of photosynthesis, is lowest in the
top third of the canopy during the day because that is where most leaf area is
present, light interception is greatest and photosynthesis is most active. At
night no light falls on the crop, but soil respiration of microorganisms is
greater near the soil surface and CO2 concentration decreases as height
increases.
Literature Cited
Monteith, J.L., and M.H. Unsworth. 2008. Principles of environmental physics.
3rd ed. Elsevier, New York.