| June 3, 2011 |
Field Crops 10.3 - 84
|
Given The Weather So Far, What Could Happen To Corn Yields?
Joe Lauer, Corn Agronomist
I often get the question, "So given the weather we have had so far, what
will corn yields be like?" Unfortunately, my crystal ball is no better than anyone
else's. In 2011, corn planted progress has been slower than average.
There is some concern that yields have been compromised due to delayed
planting. Can the corn crop recover? In similar previous years what has
been the corn crop response?
Since 1979, USDA-NASS has been collecting data on crop progress
during the growing season. By correlating crop progress with
final yield we might be able to predict some trends.
Figure 1 shows crop progress
(planted, silking, dented and mature) of selected years. Years
were selected on the basis +1
standard deviation of the 30-yr normal for the week when the planted
stage reached 67% planted. The charts show the 30-yr normal,
slow- and fast-planted years, and 2011 planting progress. The table in the middle of the figure
is the final USDA yield regressed against year to give a
predicted trendline and a departure from the trendline
(residual).
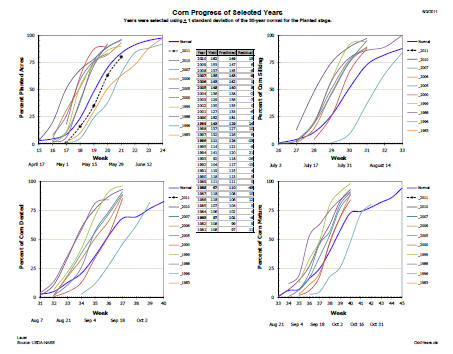
Figure 1. Corn progress (planted, silking, dented and
mature) of selected years. The table in the middle of the figure
is the final yield regressed showing predicted yield and the
departure from the trendline (residual). Data source is
USDA-NASS.
Somewhat surprisingly there were more fast-planted (n=7) years
than slow-planted (n=2) years. The 2011 growing season has
gotten off to a slow start, but it has not been significantly
slower than the 30-yr normal. Two years have been extremely slow,
1983 and 1996. During 1983, silking, dented and mature data were
not collected by USDA-NASS, but the crop finished 4 bu/A below
the yield trendline. During the 1996 production year, crop
progress was slower than the 30-yr normal at each crop stage and
ended 13 bu/A below the yield trendline.
For Wisconsin, high yielding seasons tend to have earlier than
normal planting dates. Over the last 30-yrs this has been the
case in 5 of 7 years, with the exceptions being 1988 and 2007.
One interesting production season was 2000 when planting got off
to an early start, but then due to a cool June and July crop
progress slowed and finished 1 bu/A above the yield trendline.
Weather at the Arlington and Marshfield experiment stations is
shown in Figure 2 for accumulation
of Growing Degree Units (GDUs) and Precipitation from April 1 to
May 31. Years were selected that were + 1 standard deviation from the 30-yr normal for this
period and then follows what happens to October 31. In 2011,
precipitation accumulation is similar to the 30-yr normal.
However, GDU accumulation is one of the slowest seasons in the
last 30 years at both Arlington and Marshfield. Of the 5 years
that were cooler than normal for the April 1 to May 31 period,
only one year ended the growing season above average. Generally
warm years during April 1 to May 31 ended at or above the 30-yr
normal.
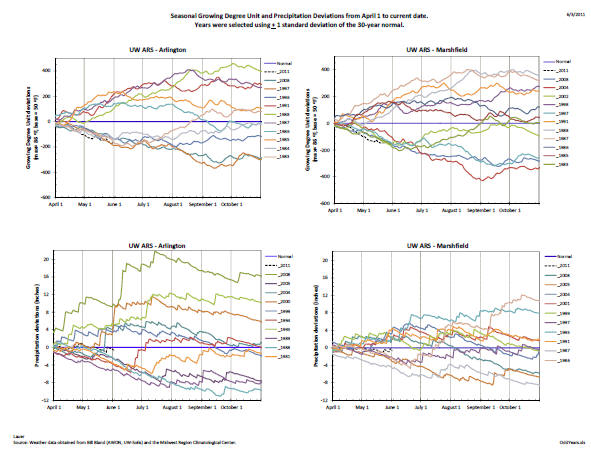
Figure 2. Season Growing Degree Unit and Precipitation
deviations from April 1 to May 31 at Arlington and Marshfield.
Years were selected using
+ 1 standard deviation from the
30-yr normal. Weather data is obtained from Bill Bland (AWON,
UW-Soils) and the Midwest Regional Climatological Center.
To view previous weather patterns of these unique years at Arlington and
Marshfield see http://corn.agronomy.wisc.edu/Research.
Again, a lot can still happen yet in the 2011 production season. The crop that
has emerged seems to be off to a good start, even though it is somewhat
late planted. Some things to consider include:
- Scouting for increased pest pressure in late-planted
corn,
- Locking in fuel prices for corn grain drying in the
fall.