Will History Repeat Itself?
July 21, 2005 12(20):156-158
Joe Lauer, Corn Agronomist
PDF file
I was curious about how much corn yield might recover this season if precipitation
was adequate from this point forward. I will not make any predictions because I
am not a good predictor of the weather. However, we may be able to go back in history
and see what happened when drought years have occurred during the first half of
the growing season.
Both long-term weather and corn production data were used from the UW-ARS at Arlington.
The period of the growing season of most interest is the period between April 1
and today (July 14). I assumed that water content of the soil profile was recharged
by April 1 every year. Roughly, 2 inches of water is present in each foot of soil.
Some soil water and precipitation is lost by evaporation and runoff. The plant uses
the rest for growth and transpiration. Corn roots generally explore 5 to 7 feet
of the soil profile. To produce 150 to 200 bu/A of grain, corn plants require roughly
20 to 24 inches of water (543,086 to 651,703 gallons).
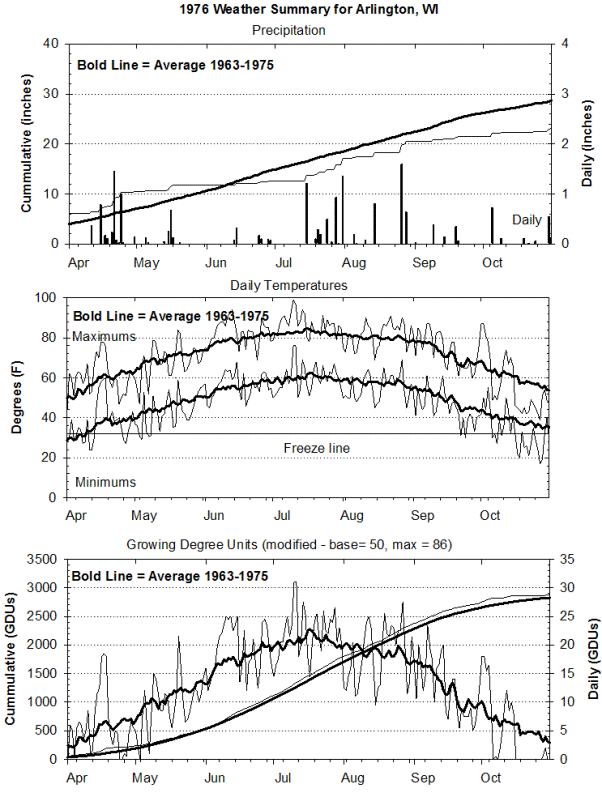
The five driest years on record (since 1963) for the period April 1 to July 13 at
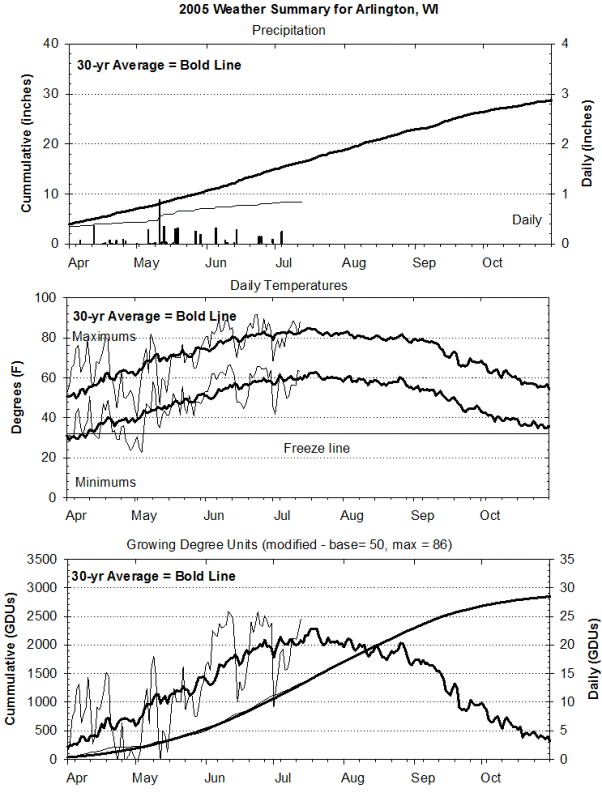
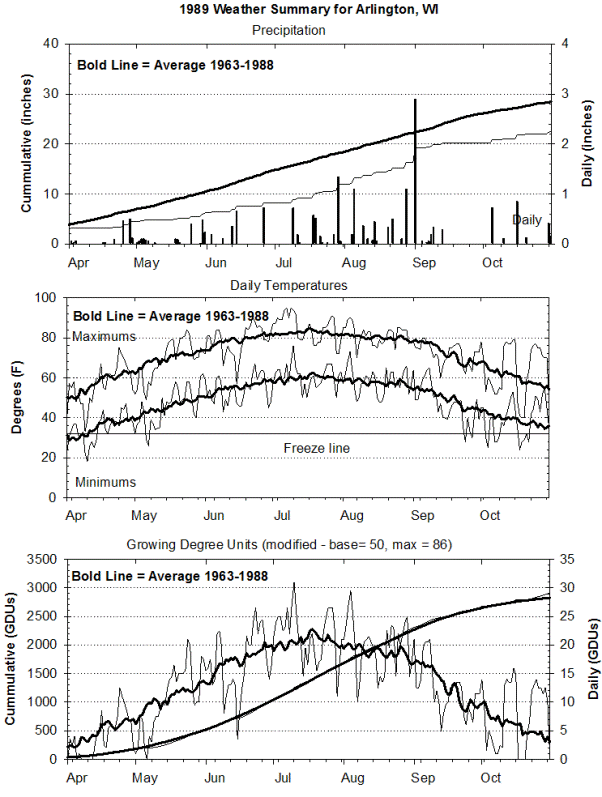
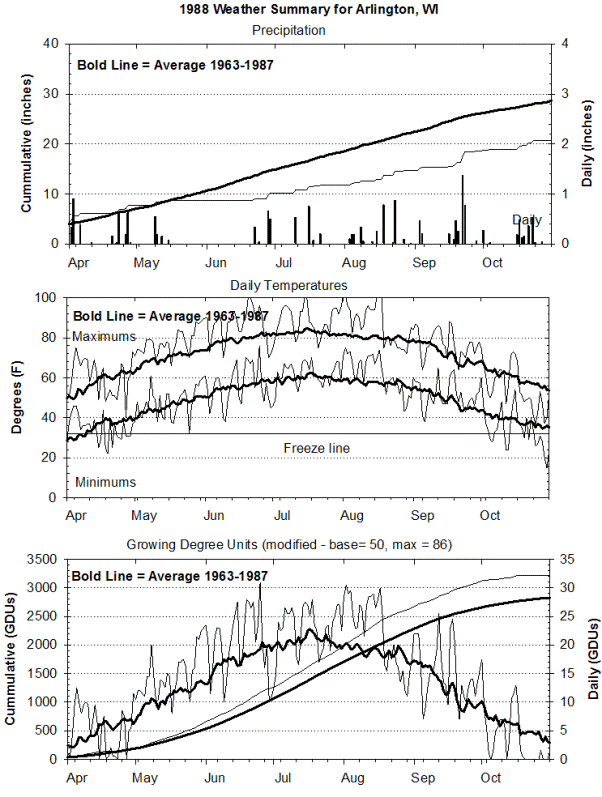
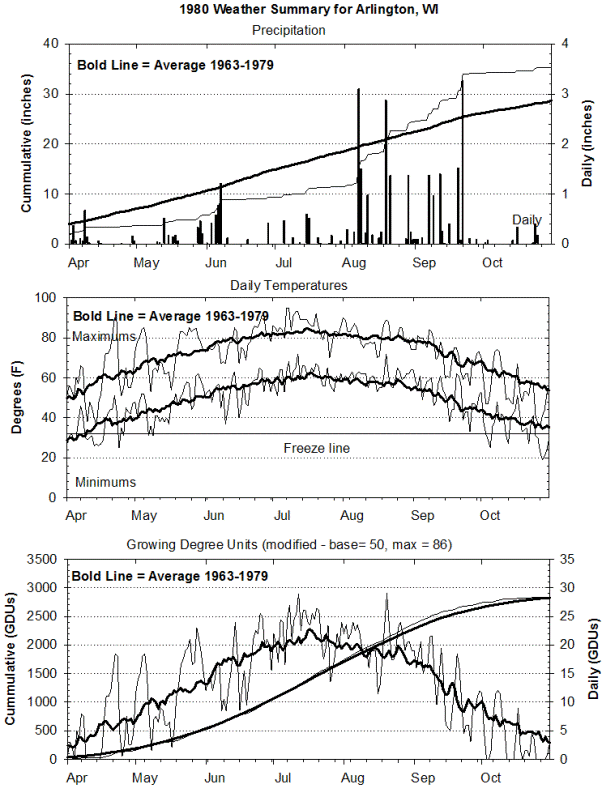
the Arlington UW-ARS are 1976, 1980, 1988, 1989, and 2005 (Table 1). During 2005,
1314 GDUs and 4.9 inches of precipitation have accumulated so far. In the other
four years for the same period, 6.1 to 8.2 inches of precipitation fell and 1267
to 1488 GDUs accumulated. The 1988 growing season was unique in that many days over
90 degrees F occurred during the season (see figures). In these years, from this
date forward (July 14 to killing frost), precipitation varied from 8.1 inches in
1988 to 24.2 inches in 1980.
Characteristics of the hybrid trials are also presented in Table 1. Planting date
in 2005 was similar to other dry years. Average yields among all hybrids in these
years ranged from 141 to 162 bu/A. Over years, hybrid genetics and management technologies
have increased corn yield at the rate of 2.4 bu/A per year in the UW Corn Hybrid
Trials. To get a feel for how these dry years yielded relative to other years in
the same time-frame, a rolling average was calculated using the 3-yrs prior and
the 3-yrs subsequent to the year of interest. Average yields of each year were compared
to the 6-yr rolling average.
Grain yield was most impacted during 1988, when grain yield was reduced 24% compared
to the rolling average years. For 1976, 1980 and 1989 grain yield was reduced 1
to 11% compared to the rolling average yields. If you visually compare the weather
summary figures, the years most similar to 2005 are 1976 and 1980. Little precipitation
fell up to the middle of July. During August and September in 1976, precipitation
fell at about 1 inch per week, while 1980 had a deluge. Grain yields in the hybrid
trials during 1976 and 1980 were only 1 to 3 % off the rolling average. So, if pollination
can occur and rains resume, we can still have some hope for respectable grain yields.
|
Table 1. Impact of the four driest years (April 1 to July 13) on corn grain yield
at the Arlington UW-ARS.
|
|
|
GDUs
|
Precipitation
|
|
UW Corn Hybrid Trials
|
|
Year
|
April 1 to
July 13
|
April 1 to
July 13
|
July 14
to frost
|
|
Planting
date
|
Harvest
date
|
Number
of hybrids
|
Average
yield
|
6-yr rolling
average yield
|
Yield
impact
|
|
|
|
inches
|
inches
|
|
|
|
|
Bu/A
|
Bu/A
|
%
|
|
2005
|
1314
|
4.9
|
---
|
|
Apr. 28
|
---
|
167
|
---
|
---
|
---
|
|
1989
|
1267
|
6.1
|
11.0
|
|
Apr. 24
|
Oct. 21
|
148
|
162
|
182
|
-11
|
|
1988
|
1488
|
6.3
|
8.1
|
|
Apr. 21
|
Oct. 25
|
166
|
143
|
187
|
-24
|
|
1976
|
1312
|
6.8
|
8.8
|
|
Apr. 24
|
Oct. 25
|
169
|
141
|
146
|
-3
|
|
1980
|
1302
|
8.2
|
24.2
|
|
May 1
|
Nov. 7
|
155
|
155
|
156
|
-1
|
