The Yield March Continues ...
December 15, 2005 12(30):228-232
Joe Lauer, Corn Agronomist
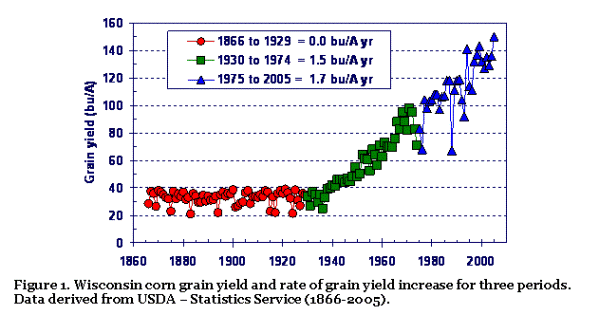
If the current USDA estimate holds, the 2005 corn production season for Wisconsin
will be the best on record. USDA – Statistics Service estimates that the average
corn yield in Wisconsin is 150 bu/A representing a 4.9% increase over the previous
record (Figure 1). The previous Wisconsin record was set in 1999 at 143 bu/A. Since
1975, corn yields have increased an average of 1.7 bu/A yr.

With the exceptions of Chippewa Falls and Spooner, nearly every location had 2005
corn grain yields greater than the average yield of the previous 10 years (Table
1). Grain yield increases of more than 25% were measured at Lancaster, Galesville,
Hancock, and Rhinelander. At Hancock, the average of 149 hybrids was 255 bu/A. A
new trial average record and hybrid performance record was measured at Hancock for
the UW Hybrid Trial program (Table 2).
Many people are asking what happened during 2005 to produce record yields. Are corn
hybrids that much better? Was it the weather? If one were to list the top reasons
for the 2005 crop, weather might not be the primary reason for the outstanding yields.
Improved hybrid genetics is often suggested. Better management might also be important.
Lets take a closer look at other record yielding years in Wisconsin. In 1994, grain
yield increased 20 bu/A over the previous record year representing a 18.4% jump,
the greatest increase ever recorded. Only three other times in Wisconsin's history
has corn yields increased at comparable rates. In 1949, corn yields were 55.4 bu/A,
and represented a 15.4 percent jump over the previous record year of 1948 when yields
were recorded at 48 bu/A. In 1952, corn yield increased 15.5% over the previous
record year of 1949. During 1966, corn yields were 88 bu/A, an increase of 15.8
% over the previous record year of 1965. It might be helpful to review the weather
during these record years of 1949, 1952, 1966, and 1994.
|
Table 1. Summary of the 2005 UW corn hybrid performance trials for grain yield
(bu/A) conducted at twelve locations in Wisconsin. ( N= number of hybrids
tested.)
|
|
|
1995-2004
|
|
2005
|
Percent
|
|
Location
|
N
|
Yield
|
|
N
|
Yield
|
change
|
|
Arlington
|
1838
|
198
|
|
167
|
227
|
15
|
|
Janesville
|
1837
|
198
|
|
167
|
217
|
10
|
|
Lancaster
|
1837
|
189
|
|
166
|
238
|
26
|
|
Fond du Lac
|
1637
|
171
|
|
149
|
207
|
21
|
|
Galesville
|
1634
|
178
|
|
149
|
238
|
34
|
|
Hancock
|
1633
|
197
|
|
149
|
255
|
29
|
|
Chippewa Falls
|
1528
|
149
|
|
142
|
130
|
-13
|
|
Marshfield
|
1362
|
158
|
|
142
|
180
|
14
|
|
Seymour
|
1204
|
161
|
|
142
|
169
|
5
|
|
Valders
|
1530
|
153
|
|
142
|
184
|
20
|
|
Spooner
|
1661
|
142
|
|
94
|
132
|
-7
|
|
White Lake/Rhinelander
|
511
|
106
|
|
47
|
187
|
76
|
Weather patterns
In 1949, conditions were favorable during most of the growing season. The month
of April was drier and warmer than normal with abundant sunshine and no extremes
in temperature. Abnormally high temperatures were observed early in May and unseasonably
cold temperatures were seen the last week in May. Planting was ahead of schedule
and crops made good progress, but were slowed somewhat by cold temperatures and
soil moisture deficits at the end of May. Dry weather during the later part of May
and the first two weeks of June was offset by good rains during the second half
of June and first part of July which replenished soil moisture. Early planted corn
ranged from knee-high to waist high by the end of June. The first killing frost
was on the September 29. Warm, dry weather during the fall was ideal for maturation
and harvest.
1952 was considerably warmer and drier than normal. In April, the first half of
the month was cold, cloudy and damp, while the second half was abnormally warm,
sunny and dry. Planting began earlier with some corn planted by the end of April.
Temperatures averaged near normal in May although the first few days were abnormally
warm and the precipitation was below normal. By the end of May, about 70% of the
intended corn acreage was planted. June was warmer and wetter than normal. Most
cornfields were better than knee high by the end of June. On October 3, there was
a killing frost. October was one of the coldest and driest on record.
During 1966, after a wet fall the previous year, March was warm and wet. During
April temperatures were slightly below normal, precipitation was normal, and it
snowed in late April. In May, subsoil moisture was adequate, temperatures were still
slightly below normal. June temperatures were a little above normal, moisture deficiencies
were reported, and corn was at normal developmental stages. July had above normal
temperatures and below normal rainfall. Needed rainfall occurred during August and
corn kept growing. September was dry with normal temperatures. October and November
was ideal for harvesting with above normal temperatures and below normal precipitation.
In 1994, planting conditions were excellent. Adequate spring soil moisture was reported
over most of the state. Farmers were able to plant earlier than normal with few
delays. By May 15, corn was planted on 65 percent of the acreage, which compared
to only 19 percent in 1993 and 46 percent for the five-year average. By May 30,
about 97 percent of the corn was planted, compared to 75 percent the previous year
and 85 percent for the five-year average. Little rainfall was recorded during May
with some parts of the state experiencing moisture deficiencies by mid-June. Timely
rains and above average heat units allowed faster growth than normal and by July
24 corn was 75 inches high and 47 percent silked compared to the five-year average
of 57 inches high and 21 percent silked. Harvest conditions were ideal with killing
frosts in October.
Common characteristics of these record years include: 1) earlier than normal
planting, 2) adequate to dry spring soil moisture, 2) mild moisture stress during
vegetative corn development with soil moisture eventually replenished to normal
levels, 3) corn development was typically ahead of normal at some point during the
growing season, 4) fall killing frosts were at the end of September or during October,
and 5) fall harvest conditions were typically dry. In the record years
of 1949, 1952, 1966, and 1994, inadequate soil moisture supplies were reported during
late May and early June. Mild moisture stress, during early corn development, increases
the allocation of photosynthate to roots at the expense of shoots and leaves, thus,
promoting deeper root growth and increased soil exploration for water, minerals
and other nutrients. As moisture stress becomes more severe, total root weight can
decrease. In all of these years, rainfall replenished soil moisture supplies to
normal or above normal levels by late June to early July.
In 2005, early planting dates and dry conditions were prevalent throughout the state.
Drought stress also occurred. This year drought was present until pollination and
timely rains allowed fertilization to take place and kernels to develop normally.
Harvest conditions were ideal.

The Yield March Continues …
The corn grain yield march continues as evident from numerous sources. Since 1975,
grain yield in Wisconsin has been increasing at the rate of 1.7 bu/A according to
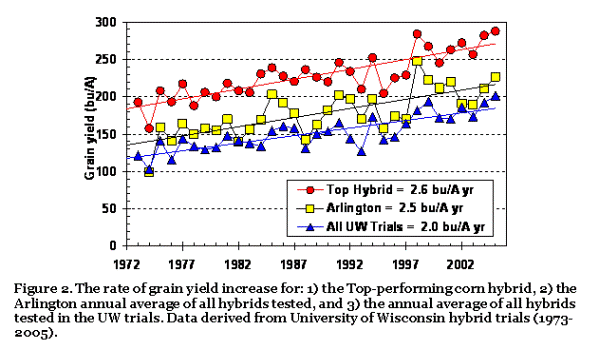
the USDA (Figure 1). In the UW hybrid trials, corn grain yields of all hybrids in
the trials have been increasing at the rate of 2.0 bu/A yr since 1973 (Figure 2).
The top-yielding hybrid in the program has been increasing in yield at the rate
of 2.6 bu/A yr.
At Arlington, the rate of grain yield increase since 1973 has been 2.5 bu/A yr (Figure
2 and Table 2). The rate of grain yield increase at a location ranges between 1.1
and 2.8 bu/A yr (Table 2). Chippewa Falls has the smallest rate of increase, while
Lancaster has the greatest rate. The Seymour and Valders locations have not had
a significant trendline over time. The record location trial average of all hybrids
tested for a production season ranges from 174 to 255 bu/A with 8 of 11 locations
setting records since 2002. The highest yielding hybrid, Dairyland Stealth 5204,
was measured at Hancock in 2005 and produced 288 bu/A.
|
Table 2. Rate of grain yield increase at a location, record year at a location, and
top hybrid performance at a location in the UW corn trials (1973 to 2005).
|
|
Location
|
Rate of Yield
Increase
|
Record Year at a Location
|
Top Performance at a Location
|
|
Year
|
Hybrids
|
Average
|
Year
|
Brand Hybrid
|
Yield
|
|
|
Bu/ A yr
|
|
Number
|
Bu/A
|
|
|
Bu/A
|
|
Arlington
|
2.5
|
1998
|
169
|
248
|
1998
|
Jung 2668
|
284
|
|
Chippewa Falls
|
1.1
|
2004
|
145
|
174
|
1994
|
Lemke SL35
|
225
|
|
Fond du Lac
|
2.3
|
2005
|
149
|
207
|
1994
|
Golden Harvest H2387
|
252
|
|
Galesville
|
2.6
|
2005
|
149
|
238
|
2005
|
Pioneer 35A30
|
285
|
|
Hancock
|
2.5
|
2005
|
149
|
255
|
2005
|
Dairyland Stealth 5204
|
288
|
|
Janesville
|
2.6
|
2004
|
173
|
237
|
1999
|
Renk RK835
|
267
|
|
Lancaster
|
2.8
|
2004
|
173
|
242
|
2004
|
Croplan Genetics 691BtLL
|
282
|
|
Marshfield
|
2.4
|
2002
|
150
|
199
|
2002
|
Dahlman D4515
|
223
|
|
Seymour
|
--
|
2003
|
137
|
202
|
2003
|
NK Brand N32-L9
|
231
|
|
Spooner
|
2.2
|
1999
|
189
|
168
|
2001
|
Pioneer 37R71
|
229
|
|
Valders
|
--
|
1999
|
168
|
199
|
1999
|
Dairyland Stealth 1280
|
239
|
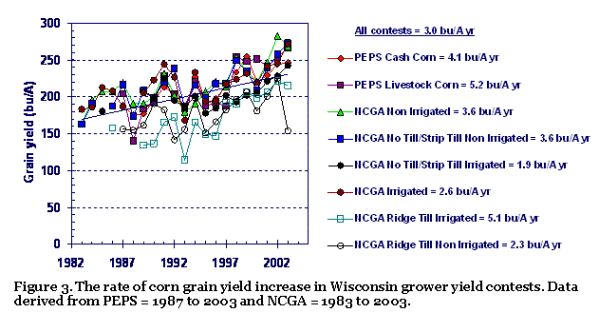
Another source of evidence that the corn grain yield march is continuing can be
found in Wisconsin corn grower contests. These contests require 10 acre fields of
which 1.25 acres is harvested and measured. Figure 3 shows the rate of increase
for various divisions of the UW Profits through Efficient Production Systems (PEPS)
program and National Corn Growers Association (NCGA) yield contest. Using the top-producer
from each division each year, the rate of corn grain yield increase was 3.0 bu/A
yr across all contests (Figure 3). The NCGA No Till/Strip Till Irrigated division
has increased 1.9 bu/A yr, while the PEPS Livestock corn division has increased
5.2 bu/A yr. The highest recorded yield for Wisconsin was 296 bu/A, and was measured
in an NCGA contest plot in Grant County during 2004.

Clearly, the corn yield march continues. The rate of progress in Wisconsin lies
somewhere between 1.1 to 5.2 bu/A yr. The development of transgenic hybrids will
likely continue the yield march through increased crop protection and continued
improved genetics. Some of the genetic and management reasons for the continued
yield march in corn include: resistance to root and stalk lodging (necessary for
machine harvesting at higher plant densities), resistance to diseases (little data
to support), resistance to insects, improvement of stay-green, continuous improvement
of second generation European Corn Borer resistance, use of single-cross hybrids,
resistance to barrenness, better pollen production, production under higher population,
earlier planting date, better seed quality, improved cold tolerance, better germination
and emergence, use of commercial fertilizers, better pest control techniques.