Managing Corn Seed Costs
Joe Lauer and Trent Stanger
Corn Agronomist and Research Assistant
Seed costs have dramatically increased over the last few years. The development
of transgenic hybrids and the associated technology fees has driven the cost of
hybrid seed to the highest prices ever seen. It is not unheard of for seed of high-performing
premium hybrids to cost $160-$180 per bag, whereas 10 years ago, premium seed would
run about $80-$100 per bag. Getting a handle on what the true value of a transgenic
hybrid means to farm profitability is challenging.
In addition, this year farmers are concerned about the cost of all inputs for corn
production. High energy prices have increased fertilizer price and there is concern
about gasoline/diesel/LP for field operations and grain drying after harvest. Minimizing
field operations (especially moving towards no-till), early planting date, and appropriate
hybrid maturity selection are management options that reduce energy costs. For a
discussion on optimum corn hybrid maturity in Wisconsin see:
http://corn.agronomy.wisc.edu/AA/A039.htm.
The underlying philosophy of the following guidelines is to maximize grower return
to plant density as seed costs continue to increase. These guidelines are based
upon research data collected in Wisconsin over the last five years and help growers
adjust their plant densities and maintain or enhance farm profitability depending
upon their farm situation. Not only has the economics of seed cost been changing,
but the yield response of corn to plant density has been increasing over time. But
ultimately, optimum plant density is affected by both seed cost and corn price.
Placing a value on seed is relatively easy in that the price of seed is known at
the time of purchase and the amount used is known after a field is planted. The
realistic value of grain will vary depending upon the producer�s ability in marketing
the grain. Corn grain that will be used on farm as livestock feed should be valued
at the price it would cost to purchase if feedstocks run short.
Table 1 describes seed:corn price ratios for seed costs ranging from $40 to $220
per bag and corn prices ranging from $1.00 to $3.50/ bu. As seed costs increase
and/or corn prices decrease the seed:corn price ratio increases. Conversely, as
seed cost decreases and/or corn price increases the seed:corn price ratio decreases.
Currently, most seed:corn price ratios range from 0.33 to 1.50. For example, the
seed: corn price ratio at $2.00/bu corn ranges from 0.50 to 1.13 for $80 to $160
per bag of seed.
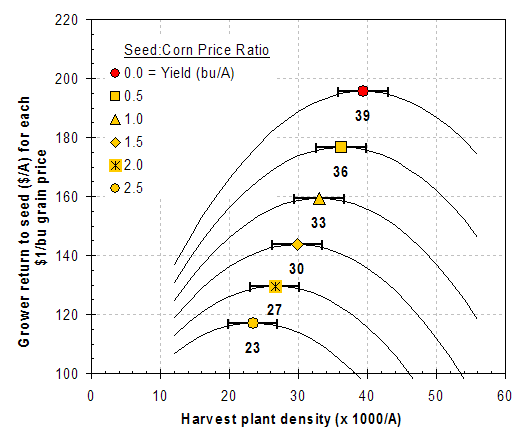
For a seed:corn price ratio of 1.0, the economic optimum plant density (EOPD) is
33,000 plants/A and grower return is at a maximum of $159/A for each $1.00 of corn
price (Figure 1). If $1.00 is subtracted from the maximum grower return ($159 -
$1 = $158), the range in plant density is 29,500 to 36,600 plants/A (error bars).
As corn price increases, grower return increases proportionally, but the EOPD of
each ratio does not change. For example, if the seed:corn price ratio is 1.0, the
EOPD is 33,000 plants/A resulting in a grower return of $159/A at a $1.00 corn price.
If the corn price = $2.50 then grower return = $159 x $2.50 = $398/A.
As seed costs increase and/or corn prices decrease, the optimum harvest plant density
decreases, (i.e. EOPD for ratio of 1.50 = 29,800 plants/A). As seed cost decreases
and/or corn price increases (ratio = 0.50) the EOPD increases to 36,200 plants per
acre. If seed cost is not considered (ratio = 0.0), then the EOPD estimates yield
and is 39,400 plants/A.
Guidelines for choosing an appropriate plant density for corn
1. Currently, seed:corn price ratios range from 0.33 to 1.50.
2. The EOPD for seed:corn price ratios between 0.5 and 1.5 is 29,800 to 36,200 plants/A.
The plant density of 32,700 plants/A is within $1.00 of the EOPD for ratios between
0.5 and 1.5.
3. Grain yield continues to increase through plant densities of 39,400 plants/A.
4. In general, silage yield continues to increase as plant density increases. However,
a trade-off exists as measured by Milk2000 where quality decreases with increasing
population. Thus, the EOPD is the same for corn grown for silage or grain. Corn
silage is often more valuable than grain and so the EOPD follows more closely seed:corn
price ratios less than 1.0.
|
Table 1. Price ratio of seed:corn (i.e. $/1000 seeds � $/bu corn).
|
|
Price of seed
|
Price of corn ($/bu)
|
|
$/80 K bag
|
$/1000 seeds
|
$1.00
|
$1.50
|
$2.00
|
$2.50
|
$3.00
|
$3.50
|
|
$40
|
$0.50
|
0.50
|
0.33
|
0.25
|
0.20
|
0.17
|
0.14
|
|
$60
|
$0.75
|
0.75
|
0.50
|
0.38
|
0.30
|
0.25
|
0.21
|
|
$80
|
$1.00
|
1.00
|
0.67
|
0.50
|
0.40
|
0.33
|
0.29
|
|
$100
|
$1.25
|
1.25
|
0.83
|
0.63
|
0.50
|
0.42
|
0.36
|
|
$120
|
$1.50
|
1.50
|
1.00
|
0.75
|
0.60
|
0.50
|
0.43
|
|
$140
|
$1.75
|
1.75
|
1.17
|
0.88
|
0.70
|
0.58
|
0.50
|
|
$160
|
$2.00
|
2.00
|
1.33
|
1.00
|
0.80
|
0.67
|
0.57
|
|
$180
|
$2.25
|
2.25
|
1.50
|
1.13
|
0.90
|
0.75
|
0.64
|
|
$200
|
$2.50
|
2.50
|
1.67
|
1.25
|
1.00
|
0.83
|
0.71
|
|
$220
|
$2.75
|
2.75
|
1.83
|
1.38
|
1.10
|
0.92
|
0.79
|
